Mason Naugle.
The Goderator responsible for these article would like to apologize for the very late post. He just woke up from a long and miserable nap. There's some sort of virus going around right now. Sore throats. Lightheadedness. Stomach aches. Wash your hands, folks! On that note, here is our second Spoons statistics article:
Welcome back, folks, to another day of number-crunching and analysis. Today, we'll be looking primarily at the distribution of kills over different days of the week, and we have some beautiful visualizations of the data. Generating a graphic of the data so that we can analyze and process it more easily is always the first step! If you're interested in learning about fun facts about kills, read “Spoontistics, Part 1”. Let's get right to it.
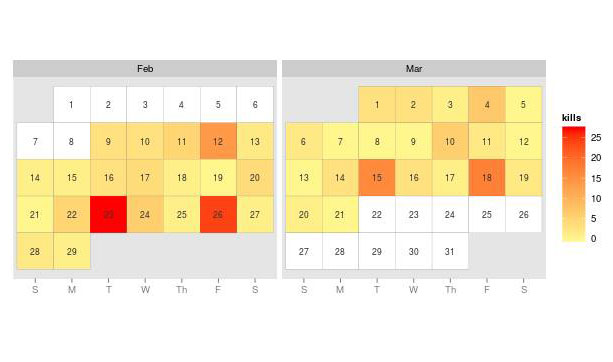 According to our calendar visual, we see that most days are peaceful (designated with yellow) while a few scattered days here and there are very violent Immunity days (designated with red).
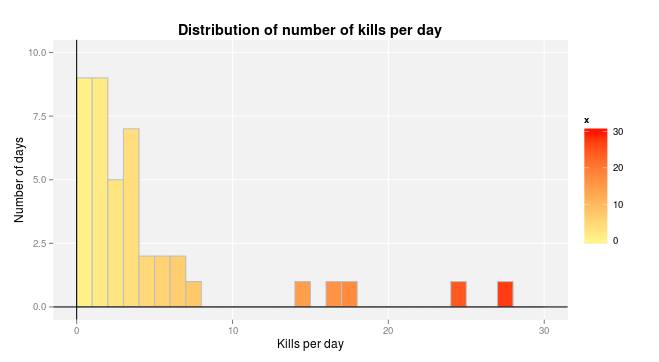 Here's just another way to look at it. The majority of days have fewer than 10 kills, seen in the yellow region on the left. These are all the regular, non-Immunity days. On the far right, we have a few outliers marked in red -- the bloodiest days.
If we compute the average kills per day, we see it comes out to be 4.55 kills per day. Yet this graph is heavily skewed to the right because Immunity days are unusually bloody relative to regular days. It's not a very typical kill value.
A more typical “daily kill” value would be the median of the dataset, since it is so skewed. The median comes out to be 2 kills per day, which aligns much better with our visual.
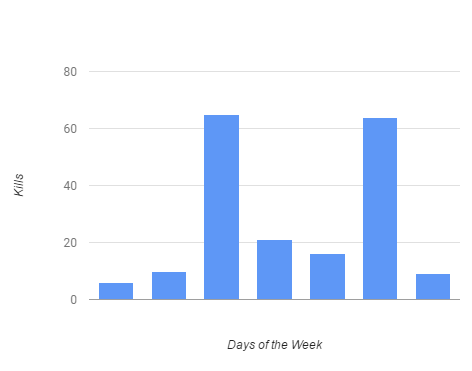 The two deadliest days by far, designated by the peaks, are Tuesday and Friday. The Immunity days. I suppose this is why Immunity days were invented, in the first place. Weekends are far less active, with a daily kill rate that is only 21.3% of the regular weekday kill rate.
Well, that's all for today. Good luck on tomorrow's Immunity! You're going to need it. If we ever decide to look at these numbers again in the future, I'm expecting a nice red square over March 25.
We couldn't have said it any better ourselves. Thank you, Statistician. We'll hear from him again soon. Until next time!